Showing posts with label Education. Show all posts

Monday, 12 December 2016

How austerity is crippling schools in southern Europe

While reforms are helping, budget cuts are sabotaging students’ performance
Fifteen-year-olds in southern European countries are struggling to catch up with their peers in international tests in maths, reading and science.
For years, southern European countries have failed to climb up the OECD’s Pisa rankings which assess the performance of 15-year-old students in mathematics, literacy and science.
Greece ranks 43rd out of 72 countries in science, the lowest score among advanced countries, and similar to the levels reported in Chile and Bulgaria. And while Spain and Italy do significantly better then Greece, both scored below the OECD average ranking 29th and 34th in the science assessment.
Two-in-10 Greek students fail to reach the baseline level of proficiency in maths, science or literacy, meaning they are unable to work out the price of an item in a different currency and struggle when reading text to pinpoint its main ideas. Worryingly, the situation has been worsening consistently in the past decade.
Conversely, in Spain, Italy and Portugal, one-in-10 students fail to reach these levels, slightly below the OECD average.
This rift was not always there. In 2006 Greece, Portugal and Italy reported very similar scores, now they differ by more than 40 points — equivalent to more than a year of schooling. Portugal dodged the group of low-performing countries altogether.
What happened to schools in Greece?
The European Commission’s education monitor says the Greek education and training sector was “strongly affected by very low and decreasing public spending, due to strict fiscal consolidation”. Indeed, funding has dropped more than one-third since 2009 and public spending on education is the lowest in the EU.
But funding is not the only problem. Teaching time in Greece is the lowest in OECD countries, about 40 per cent lower than the OECD average. The same EU report also points to “a lack of a culture of performance evaluation” as well as the need for “implementing new decentralisation measures to increase the financial and organisational autonomy of primary and secondary schools across the country”.
Contrary to most European countries, Greek schools are not able to select, pay or fire their schoolteachers, while teachers cannot pick courses, determine the content of the classes they teach or pick their text books. In terms of school autonomy, Greece ranks at the very bottom among 35 OECD countries.
So how did other peripheral countries improve their school systems?
Portugal, Italy and Spain have all introduced reforms aimed at improving the quality of teaching.
In Portugal these included a new funding formula linked to new performance criteria. Italy introduced new school and teacher evaluation systems while Spain’s school reforms — known as LOMCE — introduced a newly designed curriculum, assessments to detect difficulties at an earlier stage and a different approach to the promotion of skills-based teaching and learning.
The European Commission’s education monitor expects school outcomes in all these countries to improve further in the next few years.
Will these reforms suffice?
At this stage it is probably too early to tell, but despite the improvements Spain and Italy still have a wide gap to close and a few issues to tackle.
Both countries are marked by vast regional disparities. The poor regions of Italy and Spain are among the worst performers in the education league. Calabria, in the south of Italy, has a similar proportion of students lacking basic skills as Latin America, while students in Trento, in the wealthy north, perform similarly to their Singaporean peers, the league’s top performers.
Similarly, school outcomes in Madrid or the Extremadura region differ by 54 points in maths, a variation as wide as that between the first and the 23rd best performing countries.
While Portugal’s reformist efforts were coupled with a sizeable chunk of government spending reorientated towards education, Spain, Greece and Italy report some of the lowest shares of education spending in the EU.
Italy’s education system faced some of the most severe cuts — in some cases as high as 20 per cent — despite already being the OECD state with the lowest share of education spending.
To escape what the OECD calls the low-growth trap, peripheral countries need high human capital which can be delivered through efficient and high-quality education systems. Yet education has so far been “a net loser from austerity policies” in these countries”, according to a paper on “The asymmetrical educational consequences of economic recession in Southern Europe”.
The OECD students assessment results released this week gave further proof that peripheral countries must combine reforms with more spending, regardless of their budgetary constrains.

Friday, 25 November 2016

Four key facts about grammar schools – in charts

Theresa May, Britain’s prime minister, announced on Friday the expansions of grammar schools.

Currently there are just 163 grammar schools in England and Wales totalling 167,000 pupils, or 5 per cent of all state secondary pupils.Back in the 1960s there were nearly 1,300 schools and around one quarter of all state secondary pupils attended them.
Most of the drop happened in the 1970s when Margaret Thatcher – then education secretary – approved the closure of most grammar schools.
The South East has the highest proportion of children attending grammar schools – 12 per cent, according to a report by the House of Commons Library, while there are no grammar schools in the North East. The region accounts for 36 per cent of all grammar school students, with the vast majority in Kent.
Grammar schools are state-funded secondary schools which select pupils based on their ability and academic achievements. The academic results of grammar school pupils are notoriously much higher than those of pupils based in other mainstream schools.
Although plans to approve a fresh wave grammar schools are being floated on grounds of boosting social mobility, the evidence shows that grammar pupils are actually less likely to come from disadvantaged backgrounds.
Various studies have shown that grammar schools have a smaller proportion of pupils eligible for free school meals – a proxy for social deprivation – than other schools.
According to a Sutton Trust report “in local authorities that operate the grammar system, children who are not eligible for free school meals have a much greater chance of attending a grammar school than similarly high achieving children (as measured by their Key Stage 2 test scores) who are eligible for free school meals”.
Other studies have shown that grammar schools have larger proportions of pupils of Asian and Chinese origin, but “grammar schools have lower proportions of Black pupils than other schools”.
Although new or expanding grammars will be required to take a minimum share of pupils from lower income households, many in the educational establishment – such as Ofsted head Sir Michael Wilshaw – have expressed reservations about the plans.

Friday, 10 June 2016

Discontent among UK teachers drives recruitment crisis

Discontent among UK teachers drives recruitment crisis

“Start a new rewarding career this September” writes the Department for Education on a website inviting people to become teachers, “places are still available.” They might be available for a long time, if data on teachers’ satisfaction, recruitment and retention is to be considered.
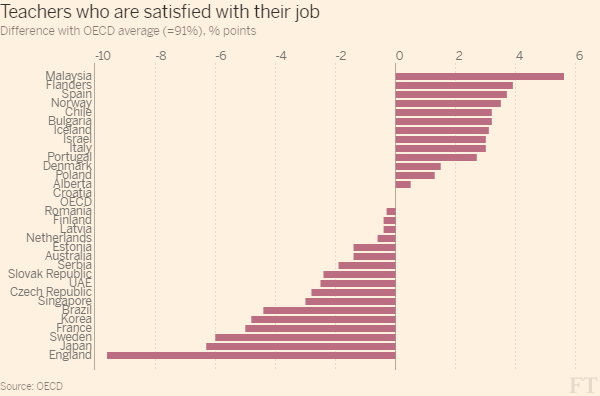
UK teachers were the least satisfied in an OECD survey of 5 million teachers across 34 advanced economies carried out in 2013. That’s ten percentage points less satisfied than the average.
And the mood seems to have deteriorated
Last year 67 per cent of teachers reported declining morale, and more than half were considering leaving the profession.
These days an even higher proportion of teachers – 83 per cent – is thinking of quitting according to research by the Association of Teachers & Lecturers (ATL) released in March.
Heavy workload
“Workload is a real issue” says Dr Mary Bousted, general secretary of ATL, in an interview with the Financial Times. “Experienced teachers are leaving the profession because they can’t stand the workload and the stress anymore.”
This finding is confirmed by teachers’ surveys which show that the volume of workload is the key reason for teachers planning to leave the profession.
Teachers in England spend more time in the classroom than most of their international peers. Moreover, in England teachers spend an average of 14 hours per week planning lessons and marking homework, that’s three hours longer than in the average of the OECD.
UK teachers are also burdened by “bureaucratic nonsense”, as Dr Bousted put it, referring to the time spent filling forms for accountability reasons.
Although the government has attempted to cut down on the workload by, amongst other measures, reducing the number of compulsory reports and plans for inspectors, the new curriculum and new policies “are placing a significant workload on teachers for the next 2 years” schools minister Nick Gibb admitted in a speech to the Association of School and College Leaders last month.
A curriculum which is “not fit for purpose”
The aim of the government’s curriculum reforms is to allow “all children, not just the offspring of the wealthy and privileged [to be] able to write fluent, cogent and grammatically correct English”.
But the majority of the teachers, and 70 per cent of head teachers, believe it is not fit for purpose. And three in four teachers believe that the policies behind the school curriculum and pupil assessments were narrow and uncreative.
“We have primary and secondary school curriculum that is highly inappropriate and ridiculously difficult”, says Dr Bousted. “A whole range of education experts, and teacher professionals, are opposed to the current curriculum and tests’”.
Other reforms were also poorly received by most teachers
Most teachers didn’t think that the proposed baseline tests for reception pupils would give a reliable measure of their progress.
And only a minority of British teachers (17 per cent) thought that turning schools into academies – independent, state-funded schools, which receive their funding directly from central government – would improve standards.
Both proposals were scrapped.
Government U-turns
So with reforms being introduced and scrapped it’s hardly surprising that the rapid pace of policy changes is why a third of teachers are considering leaving the profession.
Leaked tests being published and the delay in publishing a syllabus also add to the ‘storm of discontent’, as Dr Bousted called it, affecting UK teachers.
This leads us to a teacher shortage
Is the teachers’ discontent only temporary and linked to the “chaotic” implementation of reforms or is it a sign of more structural problems? It’s hard to say. Meanwhile, the teaching roles advertised are likely to remain unfilled.
Indeed in 2013 UK teachers had fewer years of working experience than most of their OECD counterparts. They were also generally younger, which suggests a lower retention rate within the profession.
In 2014, nearly 36,000 qualified teachers left the profession before retiring, 13 per cent more than in the previous year.
The number of vacancies more than tripled from 500 in 2011 to well over 1,700 in 2014.
This year recruiting targets were met in just three subjects: history, English and physical education. The remaining fourteen subjects faced a shortage of teachers including seven per cent gap in Maths, according to the National Audit Office.
Widening discontent
“Interestingly now, opposition is also coming from parents” says Dr. Bousted. And there are plenty of signs of this happening.
The recent strikes over the new SATs test, with nearly 69,000 people signing apetition to scrap it, point to discontent spreading beyond the profession.

Thursday, 7 January 2016

Datawatch: global children out of primary school- progress has stalled

Datawatch: global children out of primary school- progress has stalled

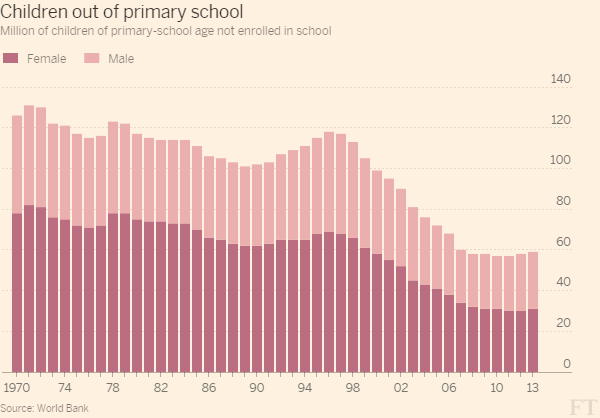
The number of children of primary school age not enrolled in school has halved since the 1970s to about 60 m. The fall was fastest among girls who made up for about two third of the number in the 1980s to just over half of the children in the latest data. Most of the children are in Sub-Saharan Africa.
However, progress has stalled. While access to education expanded considerably at the beginning of the 2000s, there has been little or no change in the global number of out-of-school children since 2007. The global primary out-of-school rate has stagnated at around 9% for the past seven years.

Primary school results: who are the higher achievers in maths? And does it matter?

The proportion of children in England achieving a good standard (level 4) of writing, reading and maths increased by two percentage points to 80 per cent this year, according to the school performance tables released on Thursday by the UK department of education. The improvement in maths was smaller, only one percentage point, but a higher proportion of children – 87 per cent- reached a good level in 2015.
In over 2,200 schools out of nearly 16,000 in England, all or almost all of the pupils (98% to 100%) were able to achieve a good level of maths. Among the towns with over 50 schools with available results, Wigan show the highest average proportion of children achieving level 4, followed by Blackburn, Warrington and London. Good maths results are homogeneously high and all larger towns have a proportion of good maths performers of 80 per cent or more.
But over 42 per cent of children achieved an even higher level of maths, level 5. In 328 schools more than two third of schools were able to achieve that level and in 33 schools more than 90 per cent of the students were able to do so.
Here is the list of those schools:
List of schools with a proportion of students achieving level 5 in mathematics above 90 per cent:
School NameTown
Little Dewchurch CofE Primary SchoolHereford
Seend Church of England VA Primary SchoolMelksham
Kniveton CofE Primary SchoolAshbourne
Frosterley Community SchoolBishop Auckland
St Patrick’s Roman Catholic Voluntary Aided Primary School, Langley MoorDurham
St Andrew’s Church of England (VA) Primary SchoolAxminster
Whatfield Church of England Voluntary Controlled Primary SchoolIpswich
Tyldesley Primary SchoolManchester
Edward Pauling Primary SchoolFeltham
St Joseph’s Roman Catholic Primary SchoolLondon
The Ferncumbe CofE Primary SchoolWarwick
Chingford Hall Primary SchoolLondon
Helmdon Primary SchoolBrackley
St George’s, Bickley, Church of England Primary SchoolBromley
Holy Trinity CofE Primary SchoolLondon
St Bernadette’s Catholic Primary School, LancasterLancaster
Bledlow Ridge SchoolHigh Wycombe
Fairhaven Church of England Voluntary Aided Primary SchoolNorwich
St Mary’s CofE Primary School, DeaneBolton
Colyton Primary SchoolColyton
King David Primary SchoolCrumpsall
Barnes Primary SchoolLondon
Ethelbert Road Primary SchoolFaversham
Scotts Primary SchoolHornchurch
St Thomas’ Catholic Primary School, SevenoaksSevenoaks
Fox Primary SchoolLondon
Paxton Primary SchoolLondon
St Mary’s Catholic PrimaryHigh Peak
Stathern Primary SchoolMelton Mowbray
Mundy CofE Junior SchoolHeanor
Park Road Primary SchoolSale
Great Tew County Primary SchoolChipping Norton
Lea Primary SchoolMatlock

Among the larger towns, Wigan showed the highest average proportion of high achievers in maths (level 5), followed by Reading, London and Cambridge.
The school performance tables reports also on the pupils that achieve an even higher level of maths, level 6. These form only 9 per cent of children in England, the same proportion as last year. But in some schools they are not so rare. In 20 schools, 45 per cent or more were extremely high maths achievers. Here is the list of schools:
List of schools with a proportion of students achieving level 6 in mathematics equal or above 45 per cent:
School NameTown
Little Dewchurch CofE Primary SchoolHereford
Fox Primary SchoolLondon
Combe Church of England Primary SchoolWitney
Seend Church of England VA Primary SchoolMelksham
King David Primary SchoolCrumpsall
Over Kellet Wilson’s Endowed Church of England Primary SchoolCarnforth
St Mary’s Catholic Primary SchoolLiverpool
Temple Guiting Church of England SchoolCheltenham
Christ Church CofE Primary SchoolOldham
Bowdon CofE Primary SchoolAltrincham
Brockswood Primary SchoolHemel Hempstead
Whitchurch Primary SchoolReading
Moseley Church of England Primary SchoolBirmingham
St Joseph’s Catholic Primary SchoolStonehouse
Stoke Row Church of England SchoolHenley-on-Thames
St Thomas More Roman Catholic Voluntary Aided Primary SchoolBerkhamsted
Wentworth CofE (Controlled) Junior and Infant SchoolRotherham
Owslebury Primary SchoolWinchester
Our Lady Immaculate Catholic Primary SchoolChelmsford
St Teresa’s Catholic Primary SchoolBristol
While Wigan is the best place for good and high achievers in maths, Cambridge shines for a higher average proportion of kids reaching level 6, followed by Reading and London; exactly the same ranking as last year.
But before you are tempted to move to Wigan, Reading, London or Cambridge in the hope that your child becomes a top maths performers, we stop and consider the interpretation of this data.
If in a top school for maths achievement (in terms of proportion of kids reaching level 4) two children out of a class of 30 – almost seven per cent – suddenly did not perform well, the school would drop below the 4000th position.
And performance for 11 years-old children (the age at which kids take the KS2 test) is based on a variety of factors apart from the quality of the school – for example how well the child slept the night before, or if they are hungry or anxious during the test.
From 2016 the test will change and the old levels will be replaced, but there will still be quantitative scores with the chance to read too much into the results and the school rankings…as we are probably doing now.

Sunday, 15 November 2015

Ethnic minorities in the UK are more likely to go to university than their white British peers

Ethnic minorities in the UK are more likely to go to university than their white British peers

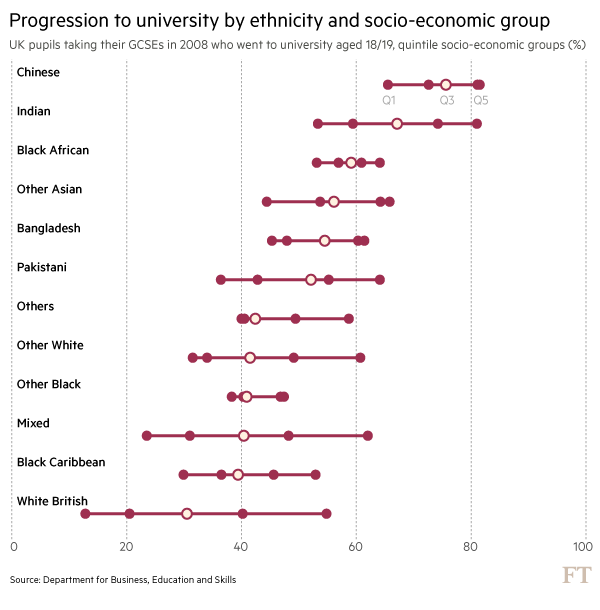
All ethnic minority groups in the UK are now significantly more likely to go to university than their white British counterparts. On average, amongst the cohort who sat their GCSEs in 2008, only one third of the white British population went to university in the academic year 2010-11 or 2011-12, compared to 75 per cent of ethnic Chinese pupils and 67 per cent of Indian students.
Progression to higher education also varies by socio-economic background with only 13 per cent of the white British pupils from the most deprived group progressing to university, compared to 55 per cent of the highest socio-economic group. This is the largest variation among all ethnic groups.
Moreover, progression to university of the most deprived white British group is by far the lowest among all groups. While only about one in ten of the most disadvantaged pupils go to University among the white British, the proportion rises to about half for the most deprived Indians and black Africans and increases further to two in three disadvantaged Chinese pupils. In fact, a larger proportion of disadvantaged Chinese goes to university than the wealthiest white British!
These are the results of research undertaken by researchers from the Institute for Fiscal Studies, funded by the Departments of Education and Business, Innovation and Skills (BIS), and published this week by BIS. The report also analyses the differences over time, from the cohort taking their GCSE in 2003, and reveals that participation amongst white British pupils increased less than for almost all other ethnic groups.
Black African pupils registered the stronger improvement with a gain of 11 percentage points in students progressing to university for the cohort 2008 compared to five years before. During this time the participation of black Caribbean and other black pupils overtook that of white British students.
The average progression to higher education is lower among the white British despite a smaller proportion being in the most deprived group (18% of white British are in the lowest socio-economic quintile of the whole population, compared to 40% of black Africans) and despite the fact that they tend to perform better at school that some other ethnic groups (the average score of key stage 2 results of the 2008 cohort for white British was 4.55 compared to 4.19 for the Pakistani group or 4.30 for the Black African pupils).
So what does explain the low rate of progression to university of the white British pupils, particularly among the lowest socio-economic group? It’s probably aspirations.
In a paper Migration and aspirations – are migrants trapped on a hedonic treadmill? The authors, Czaika and Vothknecht find that “Migrants have higher aspirations and we find strong evidence that while these aspirations are partly the result of the migration experience itself, they also had already existed before migration.” In another paper, Why the Difference? A Closer Look at Higher Education Minority Ethnic Students and Graduates, the authors Connor, Tyers and Modood surveyed potential entrants in higher education in the UK and found that minority ethic groups place greater expectation on higher education improving labour market positions than do the white British.
However, according to OECD data (Education at a Glance 2014) the earning gains and the employment rate differentials between people with tertiary education and those with secondary education are smaller in the UK than the average for OECD countries.
If ethnic minorities aspire to higher employment rates and higher earnings as a result of completing tertiary education, they are likely to achieve this, but the resultant improvements are not likely to be as pronounced as in other advanced economies.
Is there a sense in which the white British know that and don’t think that extra studying is worth the effort?