Saturday, 23 July 2016

Why Italy’s housing crisis matters

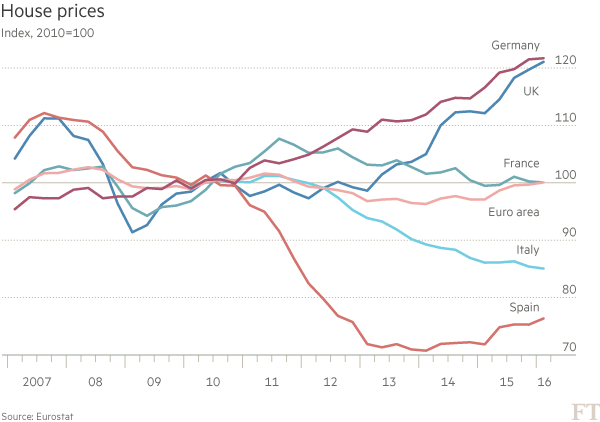
Seven years after the financial crisis, Italy’s property market has still not recovered. House prices in the country fell 1.2 per cent year-on-year in the first quarter of 2016, the only drop among major EU countries. In contrast, house prices in the region expanded at an average of 4 per cent over the same period.
Why it matters
In 2014 there were approximately 100,000 fewer construction companies in Italy compared with 2008, a fall of 16 per cent. This ran in parallel to a fall in employment of almost 30 per cent.
The thousands of property-related businesses that folded as a result brought the already fragile banking system to its kneesReal estate and construction companies account for more than 40 per cent of corporate bad debts, up from 24 per cent in 2014 – a figure which is still rising.
In the 12 months to May more than 70 per cent of the rise in gross corporate bad debt was accounted for by the construction and real estate sector.
Moreover, on average two-thirds of bank loans are secured by personal guarantees or real estate collateral, so a reduction in price automatically reduces the debts’ coverage rate.
But why are house prices falling?
The house price trend is puzzling considering that the economy has been growing since the final quarter of 2014, employment is expanding, interest rates are at a record low, real household disposable income is finally rising again and foreign direct investments are at a record high.
“The problem is a large supply of unsold housing units” explains Luca Dondi, managing director at Nomisma, an Italian economic think-tank. More than 73 per cent of Italian households own their property, compared with 65 per cent in the UK, and more than two in three property transactions in the country are homeowners looking for better housing.
“When the crisis hit Italy, homeowners refused to sell their property at a discounted price as they were betting on a strong recovery of the market in the years ahead” Dr. Dondi told the Financial Times. The number of property transactions collapsed from 860,000 in 2006 to 403,000 in 2013, the lowest volume in 30 years. That’s a fall of 54 per cent.
Over the same period, house prices fell by just 7 per cent, according to Oxford Economics, a small drop when compared to that of Spain where prices dropped by over 23 per cent.
In 2013 sellers’ expectations changed as a result of the more stable financial and political conditions, as well as better economic measures. They finally started to sell. The number of residential properties that exchanged hands increased by 10 per cent in the two years to the end of 2015, but not at the asking price.
At the end of last year, almost two in three property sellers accepted a price reduction of more than 10 per cent of the asking price and it is becoming more common to slash prices by more than 30 per cent. Such drops were not observed even in the worst years of the housing market.
In other words, the change in sellers’ expectations resulted in a delayed drop in Italian house prices.
The number of residential properties built yearly has fallen by 85 per cent since 2005 and reached its lowest level last year of just 41,000 units. Despite the reduction in available housing units, “the amount of unsold properties accumulated since 2009 is likely to be very large and we expect a further drop in house prices in the months ahead” Dr. Dondi said.
Northern Cities are recovering better
As usual in post-crisis Italy, the south is suffering more than the north. The gap between price expectations and selling prices is much wider in the south, while the recovery in the residential property market is stronger in the northern cities.
In the first quarter of this year the number of properties sold in Milan, Genoa and Turin grew at an annual rate more than 26 per cent. Compare that with the 5 per cent growth rate of Palermo, the main city of the southern island of Sicily.
Milan is also the first city to show signs of property price stabilisation. In the first six months of this year, house prices grew marginally (+0.3 per cent) compared to the previous six months. Conversely, they continued to drop by 1.4 per cent in Palermo, according to data from Nomisma.
When will the property market recover?
The consensus is that the Italian property market is improving. Fitcth, the international ratings agency, expects “improving economic conditions […] should translate into stronger housing demand and higher volumes of real estate transactions” this year.
It also predicts “an increased availability of credit, stemming from the banking system for house purchase mortgages”. The Italian Associations of Builders believes this year will see the first expansion in residential investments since 2009. In their annual report on the building industry they note that house price reduction increased affordability, with positive effects on housing demand.
But it is still unclear if the strengthening of the property market will translate to price rises. Fitch expects house prices at the national level to “bottom out in 2016” with a further upside in 2017, “although below the overall inflation rate”. However nominal annual house prices growth is not expected to turn positive until 2018, according to Nomisma, nearly a decade since they started falling.

In charts: Italy’s banking crisis Valentina Romei and Hannah Murphy

High quality global journalism requires investment. Please share this article with others using the link below, do not cut & paste the article. See our Ts&Cs and Copyright Policy for more detail. Email ftsales.support@ft.com to buy additional rights. http://www.ft.com/cms/s/0/921dee0a-4737-11e6-b387-64ab0a67014c.html#ixzz4FGd3fQ00

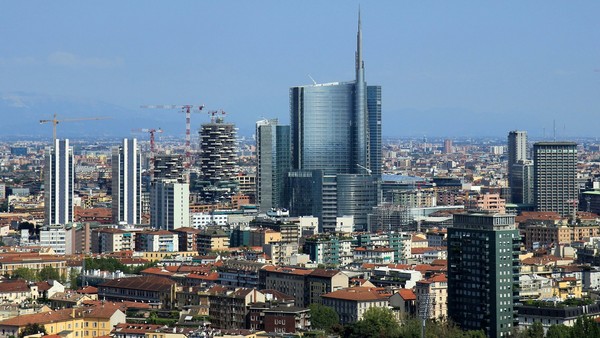
New modern skyline in Milan, Italy.
Italy’s banks are at the centre of a storm. After the drama of Britain’s vote to leave the EU, the Italian banking sector’s travails threaten to become the bloc’s next big headache.
Banking shares have fallen more than 30 per cent following the referendum, which stoked fears about the cohesion of the EU. They are also suffering ahead of July 29 stress tests that many fear will shine an unforgiving light on the sector’s weaknesses and recapitalisation needs.
Matteo Renzi, the Italian prime minister, is seeking to convince Brussels to soften new rules that require investors to take a hit if banks are bailed out. He has yet to be successful.
But some of the facts behind Italy’s banking crisis are still not sufficiently known. These include the leading role of the country’s prolonged property slump, the interplay between the stagnant economy and loans gone bad, and a recent slowdown in the pace of the accumulation of bad debt.
Here is a breakdown of Italy’s banking problem, and its causes and consequences — in charts.
Bad debt build-up
After the financial crisis Italy’s banks incurred more bad debts than their counterparts did in other countries, as companies and households found it hard to repay their loans.
The amount of gross non-performing loans held by the banks increased 85 per cent to €360bn in the five years to 2015, to reach some 18 per cent of total loans (see above). The total stock of bad debts — the most distressed part of the pile — more than doubled over the same period.
Bad debt soared as a proportion of all loans, as the chart below shows. That eight-year long climb was finally halted and reversed this year, but the proportion of bad debts edged up again in May.
The brief improvement was due to a pick-up in Italy’s economic recovery: Italian gross domestic produce expanded 1.3 per cent since the final quarter of 2014, having shrunk in the 14 months before that.
Pressure from the property sector 
Construction and real estate have played a huge — and under-appreciated role — in Italy’s banking problems. The sectors make up most of the country’s bad debt and more than 40 per cent of corporate non-performing loans — a proportion that is rising in the most recent data.
Alberto Gallo, head of global macro strategies at Algebris Investments, argues that the sheer length of Italy’s property slump has played a key role. Although the problems afflicting the country’s housing market may have been less acute than the busts that led Spain and Ireland to consolidate their banking systems, the drop in property prices was more prolonged. That resulted in more accumulation of bad debt.
By 2015, house prices had declined 14 per cent since 2010. Data released this week showed a further annual drop of 1.2 per cent in 2016 — just about the only fall in a EU country. (The Cyprus market is also failing and there are no data for Greece.)
The impact on the bank sector has been grave. On average two-thirds of Italian bank loans are secured by personal guarantees or real estate collateral. In smaller banks, the proportion can be as much as three-quarters.
Lorenzo Codogno, former director-general at the Italian treasury, warns: “The Italian property market is unlikely to show any strong recovery until there is a significant uplift in household real disposable income and business investments.”
Economic activityThe corporate sector has been severely affected by Italy’s weak growth. Companies hold the majority of non-performing loans, worth €287bn in December compared with €61bn held by consumer households.
At the end of last year, only 70 per cent of companies’ loans were performing compared with 90 per cent of consumer households loans.
But a rebound in the manufacturing sector since 2015 helped reduce corporate bad debts by €1bn in the six months to May.
Bank exposure
Not all Italian banks are the same, and nor are their exposures to non-performing loans. The latest market panic is focused mainly on Monte dei Paschi di Siena, the country’s third-biggest bank — and the world’s oldest. But the effects have rippled across the whole sector all the same.
More than one-third of all of Monte dei Paschi’s loans are non-performing. Its share price has dropped more than 50 per cent since Britain’s EU referendum and its five-year credit default swap spread, the cost of insuring against a debt default, is nearly 600 basis points compared with an average of 270 for all western banks.
Italy bad debts
Other big banks, such as UniCredit, Mediobanca and Intesa San Paolo, are in much better shape. These banks all have CDS five-year spreads of below 225 basis points — below the average for western banks.
Economic growth and bank restructuring have helped improve Italian banks’ overall profitability and reforms are likely to continue to ease pressure on the sector. In June Italy committed to speeding up insolvency procedures for non-performing loans, for example.
Further economic recovery is crucial to improving Italian banks’ outlook, but also vice versa. Repairing bank balance sheets remains a priority “to facilitate new lending and support the incipient economic recovery”, according to a recent IMF report.
According to Mr Codogno, the sharp decline in Italian banks’ stock after the Brexit vote will make it “even more difficult for banks to raise capital” — rendering it more difficult for them to write-off bad loans in the near future.

The economic factors behind the vote for Brexit


The economic factors behind the vote for Brexit

Professor Kenneth Rogoff says that the UK vote to leave the EU was a “Russian roulette for republics”, with an ‘absurdly low bar for exit, requiring only a simple majority’, with no supermajority, second referendum or parliamentary confirmation vote required.
Many voters did not have had a clear idea of what they were voting for or of its consequences, and many now seem to regret it. But the results did confirm the existence of a diffuse anger among the UK population.
At first glance it’s difficult to understand why this is the case, especially when comparing the UK with other European countries.
Before the referendum the UK economy was doing pretty well. Last year, GDP growth in the UK was the strongest among all major European countries and similar to that of the US. The unemployment rate was the lowest after Germany and in the first quarter of this year the proportion of the population in employment reached its highest level since comparable records began in the 1970s. The number of involuntary part –time workers has been rapidly declining while the proportion of those with temporary jobs – about 6 per cent – is less than half the figure of 14 per cent for developed European economies, according to the OECD.
So why the anger? Here a few possible economic reasons.
Inequality
In the UK the average income of the richest ten per cent is almost ten times larger than that of the poorest decile. In France and Germany this ratio is around seven times.
Inequality, measured by the Gini index, jumped up during the 1980s then remained largely flat through the 1990s. The years after the economic crisis saw a declining trend, but despite that the UK remains one of the most unequal economies among advanced countries. This means that even if the economy is doing well, the benefits are not evenly felt across the population.
Stagnant earnings
While the recovery in employment was strong, average earnings among those in work remained almost stagnant after adjusting for the rise in prices. According to data from the ONS that measures the average weekly earnings of employees, real salaries fell until mid-2014. Since then earnings have risen faster than consumer prices, but have not yet regained pre-crisis levels. Thus UK workers had not seen any improvement in real earnings for nearly nine years.
On top of lower real earnings, cuts to working-age benefits and tax credits contributed to reduce income growth. In other words, despite an apparently strong labour market, median household disposable income –the amount available for spending or saving – is roughly where it was at the outbreak of the financial crisis, a long time ago.
In-work poverty
The overall proportion of people in poverty has been largely flat in the last ten years,according to the Institute of Fiscal Studies (IFS). This is relatively good news, but it “masks important and offsetting underlying trends”, particularly that “there have been increases in poverty rates among working families, caused primarily by falling real earnings.”
Being in employment in the UK is increasingly not sufficient to guarantee against poverty. The child poverty rate in working families rose from 18.8 per cent in 2009–10 to 21.5 per cent in 2013–14 and similarly the proportion of parents who feel that they can’t afford basic material goods increased by more than one percentage point to 23.5 per cent in the three years to 2013-2014, “driven by rising deprivation rates in working families”, according to the IFS. About two in three children in poverty were in a working family in 2013-14, up from about half in 2009-10.
Disastrous anger vote
With poor earnings growth and stagnating disposable income, it is perhaps unsurprising that many people, especially among the poorest households, voted for an option that was promoted by the Leave campaigners as ‘catch-all’ solution to numerous problems, including meagre wages and underfunded public services.
However, the likely economic effects of Brexit hold out little hope for these voters.
Economists surveyed by Consensus Economics slashed their forecasts for UK economic growth for 2017 to 0.4 per cent from the 2.1 per cent pre-referendum. The consequences of the anger vote will not pretty.