Thursday 7 January 2016

The New World of Work: A changing landscape


August 4, 2015 11:06 am

The New World of Work: A changing landscape

More than eight years after the international financial crisis, many new jobs have been created.
But unemployment rates still remain well above pre-crisis levels.
As Europe’s post-crisis workers live through huge labour market upheaval, FT reporters look at what this means for young people, businesses and economies.
The jobs market has started to recover and unemployment rates are now declining. However, in the euro area, the unemployment rate is still 3 percentage points higher than it was in 2007. The unemployment rate in the OECD as a whole is falling faster, but has yet to reach pre-crisis levels.
Unemployment rates remain stubbornly high, particularly among peripheral European countries. In Spain and Greece it remains above 20 per cent.
While unemployment rates have declined, the proportion of people in non-standard employment has increased since 2005, according to the OECD. Non-standard jobs includes part-time and short-term workers and self-employed people.
About two in five people in employment have such contracts in Spain, Italy and Germany. Across the OECD, an average of one in three jobs are non-standard.
Temporary jobs account for more than 20 per cent of employment in Spain and an average of 11 per cent of jobs in the OECD. These kinds of jobs tend to be much more widespread among young people. More than half of those in work and aged between 15 to 24 years old in 2014 in Spain, France, Italy and Germany were in temporary employment.
France and Italy have registered some of the biggest increases in the proportion of short-term workers over the past 10 years. In Italy the rise has been particularly concentrated among the youth.
A temporary job might be a first step in the workforce, but could prove to be a trap. According to the OECD less than 50 per cent of workers in European countries in temporary jobs had full time permanent contracts three years later.
Poverty rates are much higher among people with non-standard jobs than among full-time permanent employees across all OECD countries. About 22 per cent of households that rely on non-standard work are below the poverty line.

China and Africa: trade relationship evolves

High quality global journalism requires investment. Please share this article with others using the link below, do not cut & paste the article. See our Ts&Cs and Copyright Policy for more detail. Email ftsales.support@ft.com to buy additional rights. http://www.ft.com/cms/s/0/c53e7f68-9844-11e5-9228-87e603d47bdc.html#ixzz3wbIQW4Wn

December 3, 2015 12:20 pm

China and Africa: trade relationship evolves

Chinese President Xi Jinping, centre, and Zimbabwean President Robert Mugabe, centre right, watch a performance by Zimbabwean traditional dancers upon his arrival in Harare, Zimbabwe, Tuesday, Dec. 1. 2015. Jinping is in Zimbabwe for a two day State visit during which he is set to sign some bilateral agreements aimed at strengthening relationships between the two countries. (AP Photo/Tsvangirayi Mukwazhi)©AP
Xi Jinping, the Chinese leader, is in South Africa for this week’s triennial Forum on China-African Cooperation amid concern about the effect of the Chinese slowdown on Africa.
Sino-African relations span finance, aid, health and education co-operation and trade. Most of these are not easily measurable, but those that are — in particular trade, investment and finance — show signs of weakening.
Reduced external demand and lower commodity prices caused a 13 per cent contraction in Chinese imports in the 12 months to October 2015 over the same period a year earlier. By comparison, the value of imports from Africa over the period fell 32 per cent.
The contraction in imports is steeper for Angola, South Africa, Republic of Congo, Equatorial Guinea and Zambia, China’s main African trading partners, which together account for more than 70 per cent of all Chinese imports from Africa.
China is Africa’s main export market and also its largest source of imports. After 15 years of closer trade ties, China accounts for about 20 per cent of imports in Sub-Saharan Africa and about 15 per cent of its exports. But in the past year the share of exports to China has started to decline while the growth of Chinese imports has been accelerating.
The combination of rising imports and falling exports caused the trade balance of sub-Saharan Africa to plummet.
Some African countries are more exposed to the Chinese market than the continental average would suggest. Sixteen sent more than 20 per cent of their exports to China last year and for seven, including Sierra Leone, Eritrea, Republic of Congo, Angola and Sudan, China accounted for 40 per cent of their total exports.
The steep contraction in the value of Chinese imports from Africa is largely due to the fact that commodities and crude materials make up more than 85 per cent of the total.
Aside from the general slowdown in imports and commodity prices, the data also suggest trade preferences are changing.
Take iron ore. According to Chinese customs statistics the value of total iron ore imports contracted at an annual rate of 40 per cent in the 12 months to October, while the total volume of imports contracted by only 0.1 per cent, reflecting falling demand and lower prices.
However the volume of iron ore imports from Africa contracted by more than 17 per cent annually in the year to October, while that from Latin America was stable and from Oceania — mostly Australia — increased.
Investment data confirm China is the biggest player in Africa, its interests focused on mining and oil.
In 2013, China was the largest M&A investor in Africa, accounting for 37 per cent of all deals by value, according to Dealogic. About 80 per cent of Chinese acquisitions in Africa were in the mining or oil sectors. But in the 11 months to November this year Chinese acquisitions totalled less than $600m, about 1/20th of the value of two years ago.
Chart: China-Africa merger and acquisition deals
The slowdown is even more evident in Chinese lending to support African infrastructure projects.
According to the annual report of the Infrastructure Consortium of Africa, Chinese lending for projects in 2014 was substantially lower than in each of the previous three years.
China is still the largest lending country to infrastructure projects in Africa but in 2014 it accounted for only 4 per cent of total commitments, compared with about 50 per cent the previous year.
The report said the change “may indicate a recalibration of Chinese investments in Africa’s infrastructure”.

Older workers lead employment growth in the Eurozone (lots of charts)

Older workers lead employment growth in the Eurozone (lots of charts)

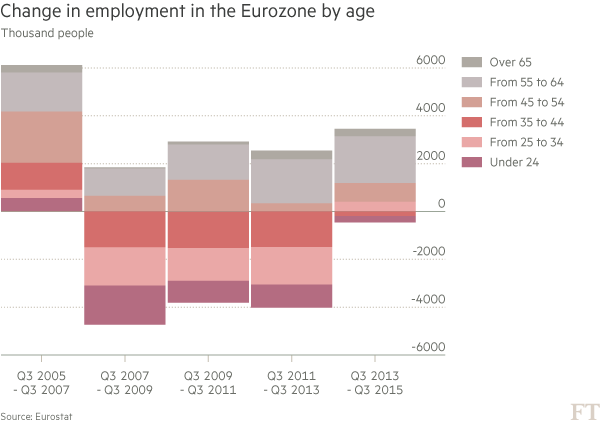
Employment is growing in the Eurozone. There were nearly 3 million more people in employment in the third quarter of 2015 than there were two years before.
However, of that 3 million around 2.3 million – or 75 per cent – were aged over 55, while the number of people in employment younger than 45 has continued to decrease.
The stronger employment performance of older workers is not new. Over the period of the crisis, jobs were lost among all age groups up to 45 years, but employment never stopped rising among the older population.
Italy lost about 1 million jobs – 5 per cent – from its employment peak in April 2008 to the trough in September 2013. Since then Italy has gained more than 400,000 jobs overall, but the number of people employed under the age of 55 has continued to decline.
In France employment expanded throughout the period analysed except for the two years to Q3 2009, but the growth was largely driven by older workers. In the two years to Q3 2015 employment for people aged under 45 expanded for the first time, but older workers still accounted for about two thirds of the net gain.
In Germany overall employment has been expanding since the start of 2010, but in contrast to France the number of people employed under the age of 45 never stopped falling. The 35 to 44 age group were hit particularly badly over the crisis and have yet to show any sign of recovery.
Spanish employment trends are different from those of the other major Eurozone countries. The employment contraction in Spain was massive. Nearly 3.8 million jobs – about 18 per cent of the workforce – were lost from August 2007 to February 2013. Younger workers were hit hardest, but there was also no growth in the employment of older workers. Since then employment has been expanding across nearly all age groups.
As with Spain, employment growth in the UK has not been concentrated among older workers. The employment performance of the group aged 45 to 55 showed an even stronger performance than the over 55 groups during and after the crisis. Those aged less than 35 were the ones hit more strongly by the crisis, but employment of these groups have grown faster since then. In the two years to Q3 2015 under-35s accounted for nearly half of all net employment growth.
But why have older workers led the employment recovery in the major Eurozone countries?
Structural reforms to pension and benefit system are an important part of the story. The trend could continue in France and Italy where, despite strong employment growth, fewer than 50 per cent of the population aged 55 to 64 were in the labour force in 2014, compared to 63 per cent in the UK.
Moreover, according to an ECB economic bulletin the strong employment trend among older people “may also reflect increased financial needs following losses in household wealth or income as a result of the financial crisis.”
Demographic effects – as the population ages – have had a larger effect in Germany where employment for the 35-44 age group contracted in terms of the number of jobs but remained fairly stable as a share of the population in that age group. However, both the absolute number of older workers and the proportion of the age group in employment have increased strongly since 2005.

But in France and more markedly in Italy the loss of jobs among younger employees and the lack of recovery have been even stronger trends than the changing demographic structure, and labour force participation rates have dropped among younger age groups over the last ten years.
High minimum wages and dual employment protection policies have beenmentioned as explanations for the lack of job opportunities for young people in both countries. In Italy, a poor vocational training system, high temporary contracts that lead to a lot of ‘churning’ and poor training of workers under fixed-term contracts all contribute to the poor employment performance among the youth.
The expansion of total employment in the Eurozone is good news, but the process now needs to involve young workers and those of prime working age.

Datawatch: GDP forecasts for 2016

Datawatch: GDP forecasts for 2016

India is forecast to grow 7.8 per cent in 2016, the fastest rate of the 85 countries in Consensus Economics’s survey of prominent forecasters. China is expected to grow 6.5 per cent, slower than Turkmenistan and Bangladesh.

Datawatch: GDP per capita growth since 1990

Datawatch: GDP per capita growth since 1990

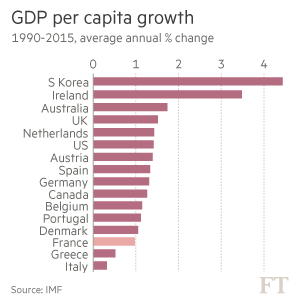
Lack of structural economic growth has contributed to political disillusionment in France. The average growth in French GDP per capita since the 1990 was the lowest among any other major European country except Italy and Greece.

Datawatch: global children out of primary school- progress has stalled

Datawatch: global children out of primary school- progress has stalled

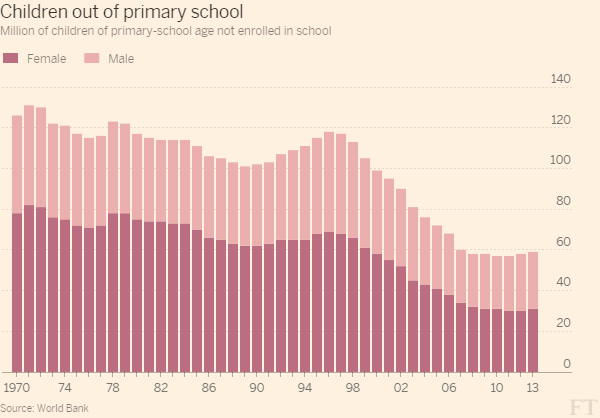
The number of children of primary school age not enrolled in school has halved since the 1970s to about 60 m. The fall was fastest among girls who made up for about two third of the number in the 1980s to just over half of the children in the latest data. Most of the children are in Sub-Saharan Africa.
However, progress has stalled. While access to education expanded considerably at the beginning of the 2000s, there has been little or no change in the global number of out-of-school children since 2007. The global primary out-of-school rate has stagnated at around 9% for the past seven years.

Three reasons why we should stop focussing on manufacturing production

Valentina RomeiThree reasons why we should stop focussing on manufacturing production

The fortunes of the manufacturing sector regularly captures the headlines while service industries are relatively under-reported by the media. Taking the number of articles on FT.com since the start of 2013 on the performance of manufacturing or services, over 600 pieces reported the manufacturing purchasing managers’ indices, while services were covered by about half that number of entries. Half of those pieces reporting the manufacturing PMI did so without any mention of the services sector, while services are almost never reported on their own.
This under-reporting and poor consideration of the services sector contrasts with the reality of contemporary economies for three reasons:
First, the manufacturing sector accounts for a small proportion of advanced economies.
In the UK and in the US manufacturing accounts for only about 10 per cent of total output, while services make up for more than 75 per cent of their economies. The manufacturing share is not much higher in other advanced economies.
Manufacturing is more important in Germany – about 22 per cent of total output – but services still make up more than two thirds of the economy. Only developing economies have larger manufacturing sectors, but the proportion progressively declines with economic development.
Second: Services are driving economic recovery.
The Markit purchasing manager index for developed markets shows that services are expanding much more strongly than manufacturing.
And GDP figures confirm the strong reliance of many advanced economies on their services sector. Real gross value added of manufacturing activities grew by an annual rate of 2 per cent in the UK and 1 per cent in the EU last year. The same figure for professional services was 7 per cent in the UK and 3 per cent in the EU.
Service activities account for almost the totality of positive contributions to economic growth in the third quarter this year in the European Union. Construction had a negative impact on growth, while manufacturing activity – the most reported sector- had a negligible contribution.
This is not a peculiarity of advanced economies. Even in China services are theengine of economic growth and the country is starting a necessary re-balancing process towards service and consumer- led growth.
Third: the distinction between services and manufacturing is vanishing.
The distinction between manufacturing and services should clear, since the first involves a tangible product and the latter doesn’t. But how important is this tangible product in the value of manufacturing production? How much does the actual value of the leather and labour involved producing a Prada handbag weigh in its overall value compared with branding, design, advertising and retailing? The same question could be asked for the cereals you eat in the morning or your smartphone.
Services are used throughout the manufacturing process and the manufacturing value chain. Some services are needed early in the chain (e.g., research and development), some are needed at the end (retailing, maintenance and repair), and some are needed at every stage (telecommunications and financial services). Individual manufacturers often require a full spectrum of services.
More than one third of all input in manufacturing in advanced economies is business services, including transport, financial services, IT and others. The proportion is higher in advanced economies than in China, where “products” input have a larger weight in manufacturing production.
Food and beverages production and vehicles production are more service-intensive than other industries, particularly basic metal industries.
The above figures refer only to the services and products that are sourced externally, but a large part of services are actually produced within manufacturing companies. This is the case of all internal research and development, sales and marketing activities and post-sales support.
So why are we focussed on manufacturing production?
Partially it’s because of a long lasting belief that you can create value only by creating tangible goods. This is deep rooted in our society and it echoes the 18th century physiocrats’ obsession with agriculture. This group of French economists held that only agriculture – or ‘the productive sector’ – can produce value added. Only planting seeds would result in new products been produced, as opposed to manufacturing – the ‘sterile sector’ – where products changed form but nothing additional is created.
Services are not a ‘residual’ sector. They account for the majority of output in advanced economies and are usually the most dynamic part of the economy. They are also a major component of manufacturing production, possibly the one that determines its competitiveness.
It’s about time we give services the space and consideration they deserve.

Primary school results: who are the higher achievers in maths? And does it matter?

The proportion of children in England achieving a good standard (level 4) of writing, reading and maths increased by two percentage points to 80 per cent this year, according to the school performance tables released on Thursday by the UK department of education. The improvement in maths was smaller, only one percentage point, but a higher proportion of children – 87 per cent- reached a good level in 2015.
In over 2,200 schools out of nearly 16,000 in England, all or almost all of the pupils (98% to 100%) were able to achieve a good level of maths. Among the towns with over 50 schools with available results, Wigan show the highest average proportion of children achieving level 4, followed by Blackburn, Warrington and London. Good maths results are homogeneously high and all larger towns have a proportion of good maths performers of 80 per cent or more.
But over 42 per cent of children achieved an even higher level of maths, level 5. In 328 schools more than two third of schools were able to achieve that level and in 33 schools more than 90 per cent of the students were able to do so.
Here is the list of those schools:
List of schools with a proportion of students achieving level 5 in mathematics above 90 per cent:
School NameTown
Little Dewchurch CofE Primary SchoolHereford
Seend Church of England VA Primary SchoolMelksham
Kniveton CofE Primary SchoolAshbourne
Frosterley Community SchoolBishop Auckland
St Patrick’s Roman Catholic Voluntary Aided Primary School, Langley MoorDurham
St Andrew’s Church of England (VA) Primary SchoolAxminster
Whatfield Church of England Voluntary Controlled Primary SchoolIpswich
Tyldesley Primary SchoolManchester
Edward Pauling Primary SchoolFeltham
St Joseph’s Roman Catholic Primary SchoolLondon
The Ferncumbe CofE Primary SchoolWarwick
Chingford Hall Primary SchoolLondon
Helmdon Primary SchoolBrackley
St George’s, Bickley, Church of England Primary SchoolBromley
Holy Trinity CofE Primary SchoolLondon
St Bernadette’s Catholic Primary School, LancasterLancaster
Bledlow Ridge SchoolHigh Wycombe
Fairhaven Church of England Voluntary Aided Primary SchoolNorwich
St Mary’s CofE Primary School, DeaneBolton
Colyton Primary SchoolColyton
King David Primary SchoolCrumpsall
Barnes Primary SchoolLondon
Ethelbert Road Primary SchoolFaversham
Scotts Primary SchoolHornchurch
St Thomas’ Catholic Primary School, SevenoaksSevenoaks
Fox Primary SchoolLondon
Paxton Primary SchoolLondon
St Mary’s Catholic PrimaryHigh Peak
Stathern Primary SchoolMelton Mowbray
Mundy CofE Junior SchoolHeanor
Park Road Primary SchoolSale
Great Tew County Primary SchoolChipping Norton
Lea Primary SchoolMatlock

Among the larger towns, Wigan showed the highest average proportion of high achievers in maths (level 5), followed by Reading, London and Cambridge.
The school performance tables reports also on the pupils that achieve an even higher level of maths, level 6. These form only 9 per cent of children in England, the same proportion as last year. But in some schools they are not so rare. In 20 schools, 45 per cent or more were extremely high maths achievers. Here is the list of schools:
List of schools with a proportion of students achieving level 6 in mathematics equal or above 45 per cent:
School NameTown
Little Dewchurch CofE Primary SchoolHereford
Fox Primary SchoolLondon
Combe Church of England Primary SchoolWitney
Seend Church of England VA Primary SchoolMelksham
King David Primary SchoolCrumpsall
Over Kellet Wilson’s Endowed Church of England Primary SchoolCarnforth
St Mary’s Catholic Primary SchoolLiverpool
Temple Guiting Church of England SchoolCheltenham
Christ Church CofE Primary SchoolOldham
Bowdon CofE Primary SchoolAltrincham
Brockswood Primary SchoolHemel Hempstead
Whitchurch Primary SchoolReading
Moseley Church of England Primary SchoolBirmingham
St Joseph’s Catholic Primary SchoolStonehouse
Stoke Row Church of England SchoolHenley-on-Thames
St Thomas More Roman Catholic Voluntary Aided Primary SchoolBerkhamsted
Wentworth CofE (Controlled) Junior and Infant SchoolRotherham
Owslebury Primary SchoolWinchester
Our Lady Immaculate Catholic Primary SchoolChelmsford
St Teresa’s Catholic Primary SchoolBristol
While Wigan is the best place for good and high achievers in maths, Cambridge shines for a higher average proportion of kids reaching level 6, followed by Reading and London; exactly the same ranking as last year.
But before you are tempted to move to Wigan, Reading, London or Cambridge in the hope that your child becomes a top maths performers, we stop and consider the interpretation of this data.
If in a top school for maths achievement (in terms of proportion of kids reaching level 4) two children out of a class of 30 – almost seven per cent – suddenly did not perform well, the school would drop below the 4000th position.
And performance for 11 years-old children (the age at which kids take the KS2 test) is based on a variety of factors apart from the quality of the school – for example how well the child slept the night before, or if they are hungry or anxious during the test.
From 2016 the test will change and the old levels will be replaced, but there will still be quantitative scores with the chance to read too much into the results and the school rankings…as we are probably doing now.