Sunday 15 November 2015

Ethnic minorities in the UK are more likely to go to university than their white British peers

Ethnic minorities in the UK are more likely to go to university than their white British peers

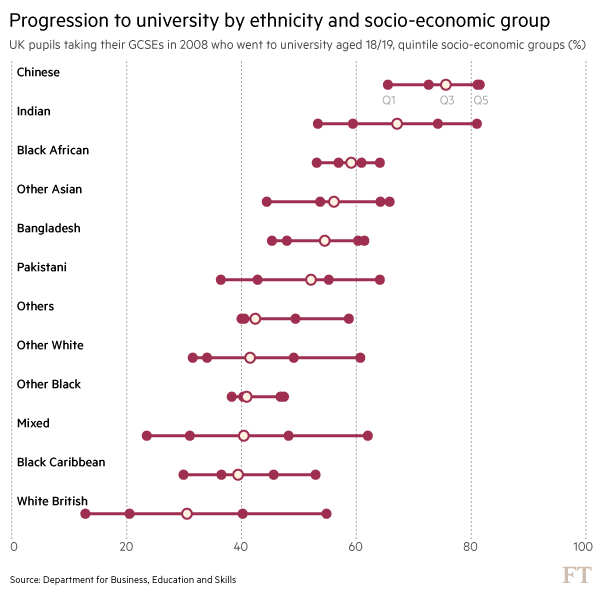
All ethnic minority groups in the UK are now significantly more likely to go to university than their white British counterparts. On average, amongst the cohort who sat their GCSEs in 2008, only one third of the white British population went to university in the academic year 2010-11 or 2011-12, compared to 75 per cent of ethnic Chinese pupils and 67 per cent of Indian students.
Progression to higher education also varies by socio-economic background with only 13 per cent of the white British pupils from the most deprived group progressing to university, compared to 55 per cent of the highest socio-economic group. This is the largest variation among all ethnic groups.
Moreover, progression to university of the most deprived white British group is by far the lowest among all groups. While only about one in ten of the most disadvantaged pupils go to University among the white British, the proportion rises to about half for the most deprived Indians and black Africans and increases further to two in three disadvantaged Chinese pupils. In fact, a larger proportion of disadvantaged Chinese goes to university than the wealthiest white British!
These are the results of research undertaken by researchers from the Institute for Fiscal Studies, funded by the Departments of Education and Business, Innovation and Skills (BIS), and published this week by BIS. The report also analyses the differences over time, from the cohort taking their GCSE in 2003, and reveals that participation amongst white British pupils increased less than for almost all other ethnic groups.
Black African pupils registered the stronger improvement with a gain of 11 percentage points in students progressing to university for the cohort 2008 compared to five years before. During this time the participation of black Caribbean and other black pupils overtook that of white British students.
The average progression to higher education is lower among the white British despite a smaller proportion being in the most deprived group (18% of white British are in the lowest socio-economic quintile of the whole population, compared to 40% of black Africans) and despite the fact that they tend to perform better at school that some other ethnic groups (the average score of key stage 2 results of the 2008 cohort for white British was 4.55 compared to 4.19 for the Pakistani group or 4.30 for the Black African pupils).
So what does explain the low rate of progression to university of the white British pupils, particularly among the lowest socio-economic group? It’s probably aspirations.
In a paper Migration and aspirations – are migrants trapped on a hedonic treadmill? The authors, Czaika and Vothknecht find that “Migrants have higher aspirations and we find strong evidence that while these aspirations are partly the result of the migration experience itself, they also had already existed before migration.” In another paper, Why the Difference? A Closer Look at Higher Education Minority Ethnic Students and Graduates, the authors Connor, Tyers and Modood surveyed potential entrants in higher education in the UK and found that minority ethic groups place greater expectation on higher education improving labour market positions than do the white British.
However, according to OECD data (Education at a Glance 2014) the earning gains and the employment rate differentials between people with tertiary education and those with secondary education are smaller in the UK than the average for OECD countries.
If ethnic minorities aspire to higher employment rates and higher earnings as a result of completing tertiary education, they are likely to achieve this, but the resultant improvements are not likely to be as pronounced as in other advanced economies.
Is there a sense in which the white British know that and don’t think that extra studying is worth the effort?

Thursday 12 November 2015

Datawatch: Vietnam is the world second-largest coffee producer

Datawatch: Vietnam is the world second-largest coffee producer

Coffee production in Vietnam doubled in the last 10 years making the country the world’s second-largest producer after Brazil. With over 27 million 60-kg bags produced annually, Vietnam accounts for 20 per cent of world coffee output, up from 5 per cent just twenty years ago.
Vietnam specialises in Robusta coffee, of which the country is the world’s leading producer. Brazilian output of Robusta – second largest – is only about half that of Vietnam. Indonesia was the leading Robusta producer in the 1990s, but it is now a minor player compared with Vietnam.
Brazil dominates the softer Arabica coffee market, responsible for 44 per cent of global production. With 38 million bags produced yearly, Brazil has no real competitor. Its production is about three times higher than that of the second producer – Colombia- and has grown nearly 50 per cent in the last 10 years.
Italy, the US and Germany are the main coffee export markets for both Brazil and Vietnam, but the latter has also a significant presence in China – its fifth largest market. Coffee consumption in China is still small, tea being preferred to coffee, but it’s rising. The potential for Vietnamese coffee production are huge.

Datawatch: employment structure in South Africa by race

Datawatch: employment structure in South Africa by race

Nearly eight in 10 African employees in the private sector in South Africa are unskilled or semi-skilled workers. Only a few have top or senior management positions. By contrast, two in five white employees are in top, senior or middle-management positions.

Chinese appetite for foreign technology companies could be good news for everyone

Chinese appetite for foreign technology companies could be good news for everyone

Chinese cross-border merger and acquisition deals are rising and China is taking its place as a leading global investor alongside the advanced economies. But the targets of Chinese acquisitions are changing. Once dominated by commodities, they are increasingly composed of technology, finance, automobile, and real estate companies.
The amount invested by Chinese companies for mergers and acquisitions abroad in the first 10 months of this year has already reached what was invested in the whole of last year, which was in turn 7 per cent higher than in 2013.
In the last five years, Chinese companies were the fifth largest source of cross-border deals after the US, the UK, Canada and Japan.
But while Chinese appetite is rising, its tastes are changing.
Chinese companies have lately targeted a number of technology companies in the US including Unisplendour buying part of Western Digital last September, Lenovoacquiring Motorola Mobility from Google, and a consortium of Chinese companies acquiring OmniVision Technologies, a US maker of image sensors used in Apple smartphones, both last year. China became the biggest investor in Italy when China National Chemical Corp announced the acquisition of the automotive tyres producer Pirelli last March.
Oil, gas and mining continue to be an important part of the Chinese shopping list, and they are the largest targeted sectors in Canada, Australia, Brazil and Peru in the last five years. The acquisition by China National Offshore Oil Corporation (CNOOC Group) of the Canadian oil company Nexen in 2012 for over 18$bn is still the largest Chinese deal in the last 5 years. The acquisition of part of the oil company Repsol Brasil in 2010 and of the Peruvian mining company Xstrata Las Bambas last year, are all in the top five largest Chinese deals in that period.
However the importance of mining and energy is diminishing. In the 10 months to October this year, technology was the top target of Chinese cross-borders deals, accounting for more than 15 per cent of all deals’ value, followed by automotive, finance, real estate, insurance and transportation. Mining and oil & gas followed as the seventh and eighth largest investing sectors.
Oil and gas has accounted for only 5 per cent of all Chinese deals this year, 11 per cent if combined with the mining sector. These are small figures when compared to the period between 2008 and 2012 when these sectors took over half of Chinese investments by value.
Not all Chinese foreign acquisitions have gone well. When Lenovo acquired IBM’s PC division, the company struggled with integration issues, substandard services and with the exodus of technical employees, so that market share and profitability fell.
According to a paper published in the “Harvard Business Review” that failure led to a revamped approach according to which Chinese companies started using overseas takeovers to strengthen the company’s position in China, rather than in foreign markets. Instead of acquiring foreign brands, sales network or goodwill, they would acquire know-how and technology.
With the new approach Chinese companies target intellectual property, knowledge, and research and design processes. The idea is that foreign engineers come up with ideas for new products and processes and the Chinese scale up the inventions in the local market.
This approach could provide the country with a much needed productivity boost. With labour costs rising and labour productivity still only about 20 per cent of that of the US, China needs to shift away from an economic growth model based on the increase of labour and capital inputs towards technology-intensive and more productive industries.
Chinese productivity is not only at a low level, it is also growing more slowly than in recent years. In the words of the Conference Board in this year productivity briefing report:
Chinese productivity is on a declining path, as rapid declines in the efficient use of capital and the returns on capital are adversely affecting productivity. This clearly suggests that China can climb the value chain only by focusing on higher productivity activities through technological change and innovation.
Acquiring state of the art foreign technologies and R&D facilities to grow in the domestic market could be the way to square the circle of the Chinese need to rebalance its economy away from the exploitation of cheap labour – as well as a source of investment to cash-strapped companies in the advanced economies.
On paper, it sounds good news for all concerned.

Datawatch: highest support for the euro since 2002

Datawatch: highest support for the euro since 2002

The share of the Eurozone population reporting that the single currency is a good thing stood at 61 per cent in the latest annual survey from Eurobarometer, up 4 percentage points from the previous year, and compared with 45 per cent in 2007. This is the highest level since Eurobarometer started tracking support in 2002.
The largest increase in popularity was in Portugal where support rose by 11 percentage points, but a strong uplift was also registered in Austria, Greece, Spain and France.
In contrast in Finland, where the economy is still struggling to recover, the support for the euro dropped.
Despite this general rise in popularity, fewer than half of Italians have a favourable view of the euro, the lowest proportion across all Eurozone countries.
The report also shows that men (66%) have a more favourable opinion than women (57%) and young people (71%, aged 15-24 years old) more than older age brackets (59-61%).

Wednesday 11 November 2015

The UK and India: a match not made in trade

The UK and India: a match not made in trade

India should be a good strategic trade partner for the UK. With an economic growth faster then China – set to top seven per cent this year, a rapidly improving business environment and a large Indian-born population resident in the UK, it seems the perfect target market for UK companies.
Except that it is not.
The UK sends a marginal – and declining – part of its merchandise exports to India, and imports from India form a negligible share. China, in contrast, has a larger and rising importance as an export market and is now the UK’s second largest supplier of goods after Germany.
The UK was very important for India in the early decades after independence in 1947, trade with the UK accounting for about one third of all Indian merchandise exports and imports. But that reliance has long gone, and now India trades mostly with other Asian countries and with the US.
UK merchandise exports to India are now composed more of commodities, particularly oil and gold, than was the case twenty years ago. Machinery forms a smaller proportion.
Over the same period, Indian exports to the UK also changed composition, with an increased share of motor vehicles, engines, medicaments and aircraft, while the importance of textiles exports have shrank. In 1995 the top eight India products exported to the UK were all related to clothing and textiles, including men’s clothing, cotton fabrics and textile yarn. Last year, cars and medicaments were among the top five exported products.
The poor merchandise trade performance is not due to the two countries trading mainly in services. UK services imports from India are low and declining, just about 2 per cent of the total. Last year the UK imported over ten times more services from the US than it did from India. In contrast UK imports of services from other Asian countries, including Hong Kong, Singapore and Thailand, are rising. Last year India accounted for only 13 per cent of all services imports to the UK from Asia, down from 22 per cent in 2010.
The story is not much different in terms of investments.
While the UK was a the third largest equity investor in India in the last 15 years, its role has been declining and it moved down to the sixth position in the fiscal year ending March 2015.
Merger and acquisition deals – a large part of all foreign direct investments – have been rising between the two countries, but not forming a recognisable trend. UK acquisition deals into India accounted for only 7 per cent of total foreign acquisitions of UK companies in 2014, and the proportion shrank further in the first ten months of this year.
The main target by far of UK companies in India is the telecoms sector, possibly the result of UK companies using contracted telecom services from India, followed by oil & gas and consumer industries.
But if UK and Indian relationships are weak in terms of trade and investments, they are strong in almost any other respect.
In the 2011 UK Census, India was the most common country of birth of non-UK born residents, replacing Ireland for the first time since at least 1951. According to the latest ONS estimates there are about 800,000 residents of the UK that were born in India, about 9.6 per cent of the total non-UK born resident population. The Indian-born population is the largest non-UK born group in London, the North, South East and the West Midlands.
Indian representation is even higher in the medical professions. About 9 per cent of all doctors practicing in the UK gained their medical qualification in India, the largest share of those from outside the UK.
India provides the second largest group of international students after China, with about 20,000 students in higher education in the academic year 2013-2014, about 6 per cent of all non-EU international students. However, the number shrank from nearly 40,000 in the last decade, in contrast with the rise in the number of Chinese students.
Indian tourism is also important for the UK. Indian tourists spent nearly 10 million nights in the UK last year, the ninth largest by any country. Both the number of visits and the nights spent in the UK by Indian visitors have almost doubled since 2003.
India is still a poor country, its GDP per capita is less than half that of China and below that of the Philippines. Its institutions are less business-friendly than in other Asian countries – it ranks 130th in the World Bank’s ‘Ease of doing business’ rankings, below China in the 84th position, although above the regional average.
However, Indian economic growth is strong and is expected to accelerate next year compared to slowing growth in China. Data from the World Bank and the World Economic Forum show that the business environment is improving, with easier access to electricity, quicker and cheaper procedures to start a business, and better government institutions. Poverty is declining rapidly and the middle-income population is forecast to reach a quarter of the total by 2021 according to calculations from Brookings and the OECD, up from just over one per cent in 2000.
The business potential from a stronger economic relationship between the two countries seems huge.

Tuesday 10 November 2015

Datawatch: internationalisation of SMEs

Datawatch: internationalisation of SMEs

About two in three small and medium-sized enterprises in the EU have a website presenting their products and/or services according to a Eurobarometer survey of more than 14,000 companies. The share is higher in Northern Europe with nearly 9 in 10 companies having that facility in Denmark.
In Italy less then half of the companies have a website, the lowest proportion in the European Union.
The report also investigates the level of openness to external markets and it shows that one in three SMEs in the European Union exported to another country in the three years preceding the survey and a slightly larger proportion imported from abroad.
Denmark and Germany report higher levels of internationalisation, while less then one in four SMEs sell their products and services abroad in the UK, France and Italy.

Datawatch: export of sparkling wine

With the success of Prosecco, Italy is now the world leader in exports of sparkling wine, with export volumes nearly 50 per cent higher than from Spain and France. Italy surpassed France in 2009 and Spain the following year.

Datawatch: royalties and licence fees exports

Datawatch: royalties and licence fees exports

The US dominates the export of royalties and fees, the charges for the use of proprietary rights (such as trademarks and copyrights). The UK was the second-largest exporter in the 1990s, but fell to sixth by 2013. China only accounts for 0.3% of the global total.

Datawatch: change in labour force participation rates by age

Datawatch: change in labour force participation rates by age

Participation in the labour force in G7 countries has risen among those aged 55 and over but fallen for younger people since the start of the financial crisis. For those in their thirties, participation has fallen for men and risen for women.

Datawatch: share of exports to other TTP countries

Datawatch: share of exports to other TTP countries

About half of the merchandise exports of the 12 Trans-Pacific Partnership go to other TTP countries. The share is higher for Mexico and Canada because of their strong trade links with the US, but it is below one-third for Australia, Japan, Singapore and Chile.